Systems Diagrams

many different ways of naming and classifying
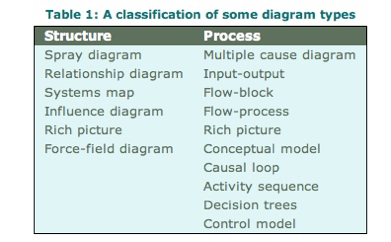
If you were to Google “Systems Diagrams” you would find a plethora of diagram types and conventions. In this brief overview my intent is not to teach you a taxonomy of diagram types, but simply to sample a few so that you can see a range of possibilities and have some understanding of the utility and limits of different ways of visualizing relationship between the elements of a system, or between multiple systems.
I will group them into three categories, namely those that focus on:
-
1)What is related to what?
-
2)What is the form of the influence of one element on another?
-
3)How big are the influences?
2. What is the form of the influence?
Does one element cause another to increase or decrease? What are the functional relations between the elements?
In order to begin answering these questions more discipline in how one articulates the elements of the drawing is required. There arrows or connections between the elements have to be elucidated. Not only do we say there “is a connection” but we need to specify something about the nature of the connection.
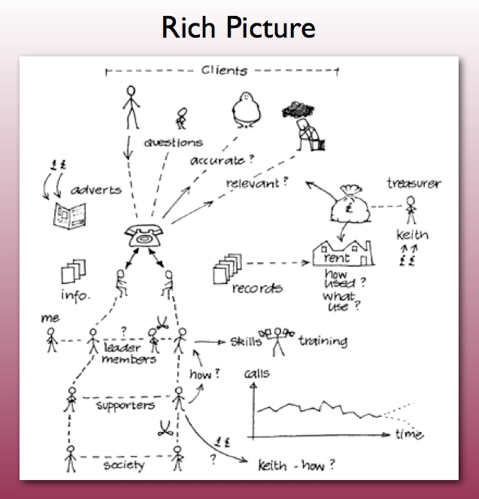
rich pictures
Rich pictures are much like mind maps, with two difference. First of all they are mostly intended for groups of people working together on one canvas. Second they encourage the use of lots of imagery to convey more than just the words might. Thus in a community process they help people to visualize unspoken assumptions.
Rich pictures are often used as a first step in the Soft Systems Methodology.
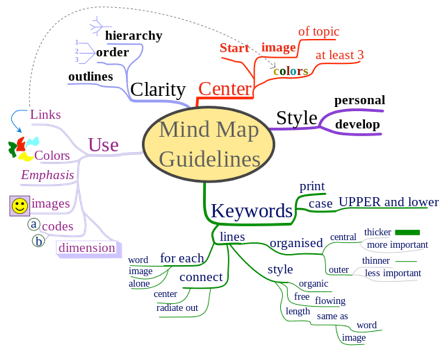
mind maps
Mind maps have become such a popular thinking tool largely, in my view, because they do not require much precision in thinking and hence can be used as a sketch to lay out a basic structure of how any one person (or group) sees a set of related ideas.
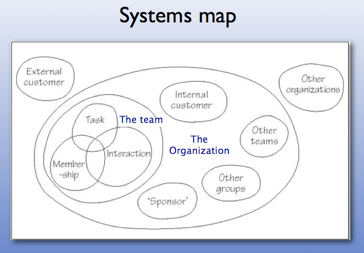
Mind maps are generally created with a central point or issue to which ancillary concerns are connected, usually through several branches. They can also be created as a set of nested containers, one thing inside another (similar to system maps).
One of the limitations of mind maps is that there is generally no intent to distinguish values from things from processes from concerns. Anything that seems to be relevant from the perspective of the person(s) drawing the map is appropriate to include. Thus, mind maps serve particularly well to generate an overview of all the considerations entailed with any given central concern.
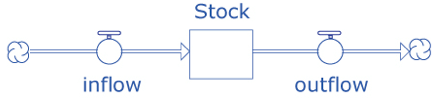
stock flow diagrams
Chapter 1 of the Donella Meadows text “Thinking in Systems” is a good resource for understanding stock flow diagrams.
Consequently I will not elaborate here, but I do recommend you check on the bathtub animation, and the little lesson (below) that shows how the bathtub can be represented by a stock-flow diagram.


D.L.Kauffman: Systems One, 1980

.oOo.

Open University, (link to image lost)
1. What is connected to what?
Connections are basic. Seeing the connections between one thing another enables us to start thinking about any system, whether that is as elementary as considering the parts of a human body as represented here by the children’s song “The kneebone is connected to the thigh bone” or the complex pattern of connections we are now able to map for the internet. (other connections between living systems don’t readily report themselves to an image processor).
Hence several types of systems diagrams are intended specifically for us to map out these connections.
If you want to add the notion of how big the influence is, you are entering another realm, namely you have to “animate” your diagram by actually specifying the degree of influence and calculating the net effect of all the influences along a chain or through a network. Since this leads to considerations of the dynamics of the situation through time, you have to repeat the calculations as soon as everything changes. We end up modelling the system dynamics.

Skeleton Dance,
Super Simple Learning

Internet Map (detail)
Wikimedia Commons
The Open University
The Open University has a policy of making its course materials available, and students pay for the relationship with instructors and the credit. This means their work is freely accessible for those who wish to explore.
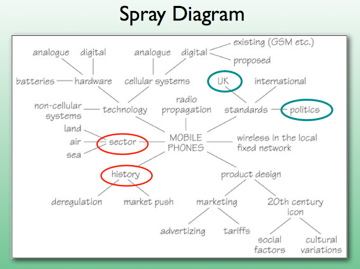
The course “Diagramming for development 1” has a very nice section on diagramming. Several of the images in this section are copied from that course. Click on the logo to go directly to the course for an overview of rich picture, spray diagram and system map. Note that the latter two correspond to two different ways that people construct mind maps.
Wikimedia Commons,
click on image for Wiki article
click on image for further details on Rich Pictures


feedback
The word “feedback” has migrated to conversation as a request to the listener to tell the speaker what he or she heard or understood, ideally so that the speaker can modify his or her utterance so the reported understanding more closely matches what is intended.
What this has in common with the systems notion of feedback is that the influence circles around. In a conversation there is usually no need for many cycles, but in most situations where we wish to speak of systems feedback, the circle is ongoing, that is each continues to influence the other. In the human domain this could be seen, for example, as an ever escalating argument.
And that brings us to some more confusing vocabulary. In conversation we consider “positive feedback” to mean that we say something that makes the situation better. In systems terms, positive feedback has a different meaning.
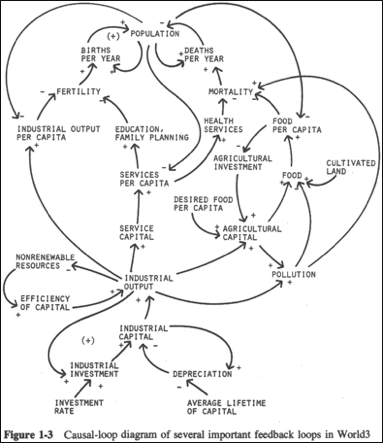
causal loop diagrams
Most systems of interest aren’t textbook simple. There are multiple influences, and we can label them all as either positive (A increases B) or negative (A decreases B). As we label a whole network this way we can discern reinforcing loops where two or more positive or negative connections circle around to create an accelerating or “run away”effect.
We can also discern loops where the positive effects appear to be balanced by the negative effects.
There are problems. First, it can obviously get too complex to determine what the combined result of all the influences is. Second, these figures have no way of indicating magnitude or nonlinear relationships.

“The turning point” photo Iain Young


positive = reinforcing feedback
What positive feedback means in systems terms is more like that which we get from a loud blast when we have a sound system set up so that the microphone responds to the sound from the loudspeaker and the amplifier makes that even louder. A positive feedback loop leads to a runaway system. However, the runaway can also be a cycle of less and less leading towards extinction rather than escalation, so its better to use the more explicit name of a “reinforcing” cycle.
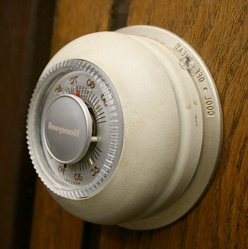
negative = balancing feedback
A negative feedback loop happens when an increase of A causes B to increase, but an increase of B causes A to decrease. This leads to a balancing of the level of both. In the human conversation this can show up as a de-escalation of a tense situation. Homeostasis depends on positive feedback, though of course metabolism is much more complicated than a single loop. A simple example is hunger and food consumption. If we are hungry, we eat, which leads to a reduction of hunger so that we stop eating... and not eating eventually results in hunger again.
What is implicit in balancing feedback is that the system has the capacity to measure its current condition. For example a thermostat /furnace feedback loop requires that the thermostat be sensitive to temperature.

Wikimedia Commons
D.L.Kauffman: Systems One, 1980
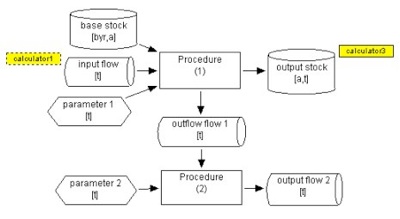
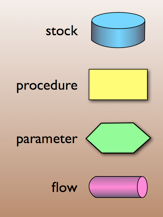
stocks, flows, calculators and regulators
The stock flow diagram uses boxes for the stock, arrows for the flow, and taps for the regulators. More substantive representations discriminate between procedures and parameters that more fully represent the dynamics; and flow rates are explicitly tracked. These types of images, used as a basis for simulation modelling, will not be covered here.
The small sample of how these get linked is from the WhatIf? Technologies group. If we had more time in this course it would be very insightful to play with their Global Simulation System.
3. How big are the influences?
Once we begin to ask the question of “how much” or how big” we have to quantify. And in order to quantify we have to specify what it is we are talking about. If there is an effect of X on Y then we have to be able to specify how big X is, how much each size influences Y, and what the resultant size of Y is. This is easiest if we can restrict our interest to tangible things that can move from one place to another, but it can also apply to the movement of something like energy from one compartment to another.

photo Iain Young